Good evening,
I spent a couple of hours tonight getting my forecast from Photoshop to a GIS software so I can overlay the data in a better way than just putting an image over the original map. The shaded regions are what I forecasted (not perfect, but should be very close to the position in the graphics) for the first forecast, which was Wednesday, 1/8 at 8 PM, and the other was the last forecast, on Thursday, 1/9 at 2 PM. The numbers on the reports are the reports that the NWS gathered. I only filtered out to make sure that the only reports showing were the snow type reports in case there was storm damage, ice, etc. Also worth noting that I only focused on the area inside the red box when making the forecast as the top and bottom are hidden due to overlays. You can look at one of the forecast graphics from Wednesday or Thursday to see what I am talking about.
I want to be as open and as transparent as I can be with each of you, and show you actually how the forecast turned out instead of just moving on. I go back and take a look at every forecast that I put out to be able to try to get an idea of where I did good, where I did bad, and in between. Weather is not a perfect science, and while there are some patterns that are close, there will never be a 'repeat' deal, so therefore, while I know I can't be perfect at it, I am going to give it the best shot I can, and be the best at it, and that includes being able to admit when you mess up. So... for those that are ready to go at me for a wrong forecast, here is your ammo.
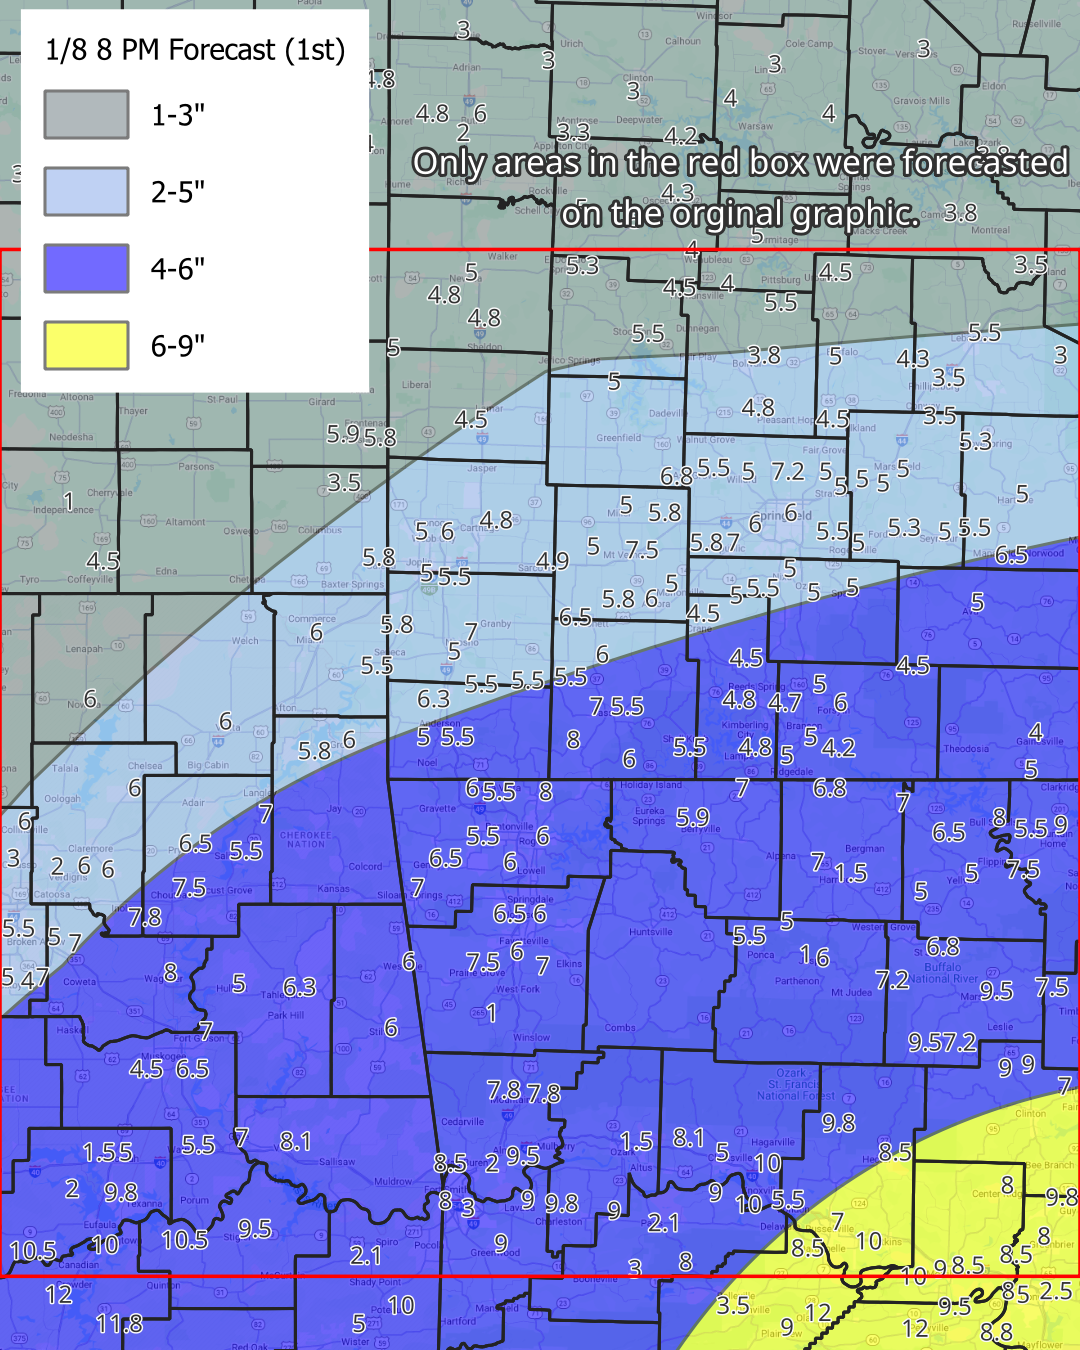
1/8 8 PM Forecast | First Forecast
1. Was way under on snowfall totals, every forecasted area was either pushing the max, or exceeding the high amount for that area. Most of the reasoning for that was mainly due to low confidence in my end, as at that point, the amounts and locations were changing on every run of every model.
2. Grouping of amounts was better, but not perfect, while the upper bound of the 4-7" range was close to being on target, it could have used a shift north a bit, close to the US 54 corridor instead of 60 corridor. That would have pushed the 2-5" and the 1-3" farther north as well, which would have been close looking at the post event data.
3. Higher amounts in Arkansas were showing around the time of this forecast, however, I was trying to go back and find out how often Little Rock gets 9-12 inches of snow in a day. As you could imagine, there wasn't much, if any history of that, so that made me very cautious of raising those amounts, even though that area really is outside of the bounds I feel comfortable forecasting.

1/9 2 PM Forecast | Third and Final Forecast
1. Should lead off by saying by the time I got done looking at data, sketching it out, digitizing it, and typing up the post, snow was already starting to fall for many. I know some will see that and be like "You already had an idea since snow was falling", but unfortunately, it takes an hour and half to two hours just to get a simple map like this done and out. I don't have a fancy software that can use model data and do one for me, or a crew of people that can do it while I sit around.
2. I feel much better overall with this forecast. In terms of the area that I mainly forecast, I feel like it turned out alright. Couple spots in NE Benton, into SW Barry and SE McDonald that were higher than what I had forecasted, but with snow bands, that is an okay result.
3. Certainly could have extended about every range farther north, especially the 2-5, as it would be close to needing to be all the way up to I-70 to be 100% correct. Could have pushed the 4-7” range to the north and west a little, likely to the other side of the I-44 corridor in Oklahoma, and close to Jasper, Greenfield, and Pleasant Hope in Missouri to make me feel better about it. Trying to forecast the western part was tricky as it was really dependent on where the moisture was, and if there would be enough to support moderate to heavy bands of snowfall across that area.
4. I feel like most places were in the right area ,especially across McDonald, Barry, Lawrence, and down into NWA in Benton, Carroll, and Washington counties in terms of amounts, other than a few outliers here and there.
Few additional updates outside of the forecast review:
- The woolawaywx.com website will be having blog posts on it as well just to be able to have a place to post stuff that is mine per se.
- The school closings page will be getting its own dedicated page instead of a post, and hopefully will allow users to add closing themselves as well.
- The road condition map was getting updates throughout the event to make it better and deal with data issues.
Overall, I feel like the last event, like every event, is a good one to learn from. While I prefer most other types of weather over winter weather in terms of forecasting and discussing, it must be done. I want to say thank you to those who made it this far into the post. I know it was long, but I wanted to discuss this as I believe it is important to be transparent with this stuff. I also want to thank everyone who liked, shared, commented, and viewed my post on Facebook as we got just over 90,000 views over the last 10 days, which is amazing! So from the bottom of my heart, thank you! Without you guys, the page would not be what it is today!
- Cade