WAWS
WoolawayWx Automated
Weather System
Honest Data. No Agenda.
Click on any image below to view it in full size, or click the play button to see a time-lapse animation.
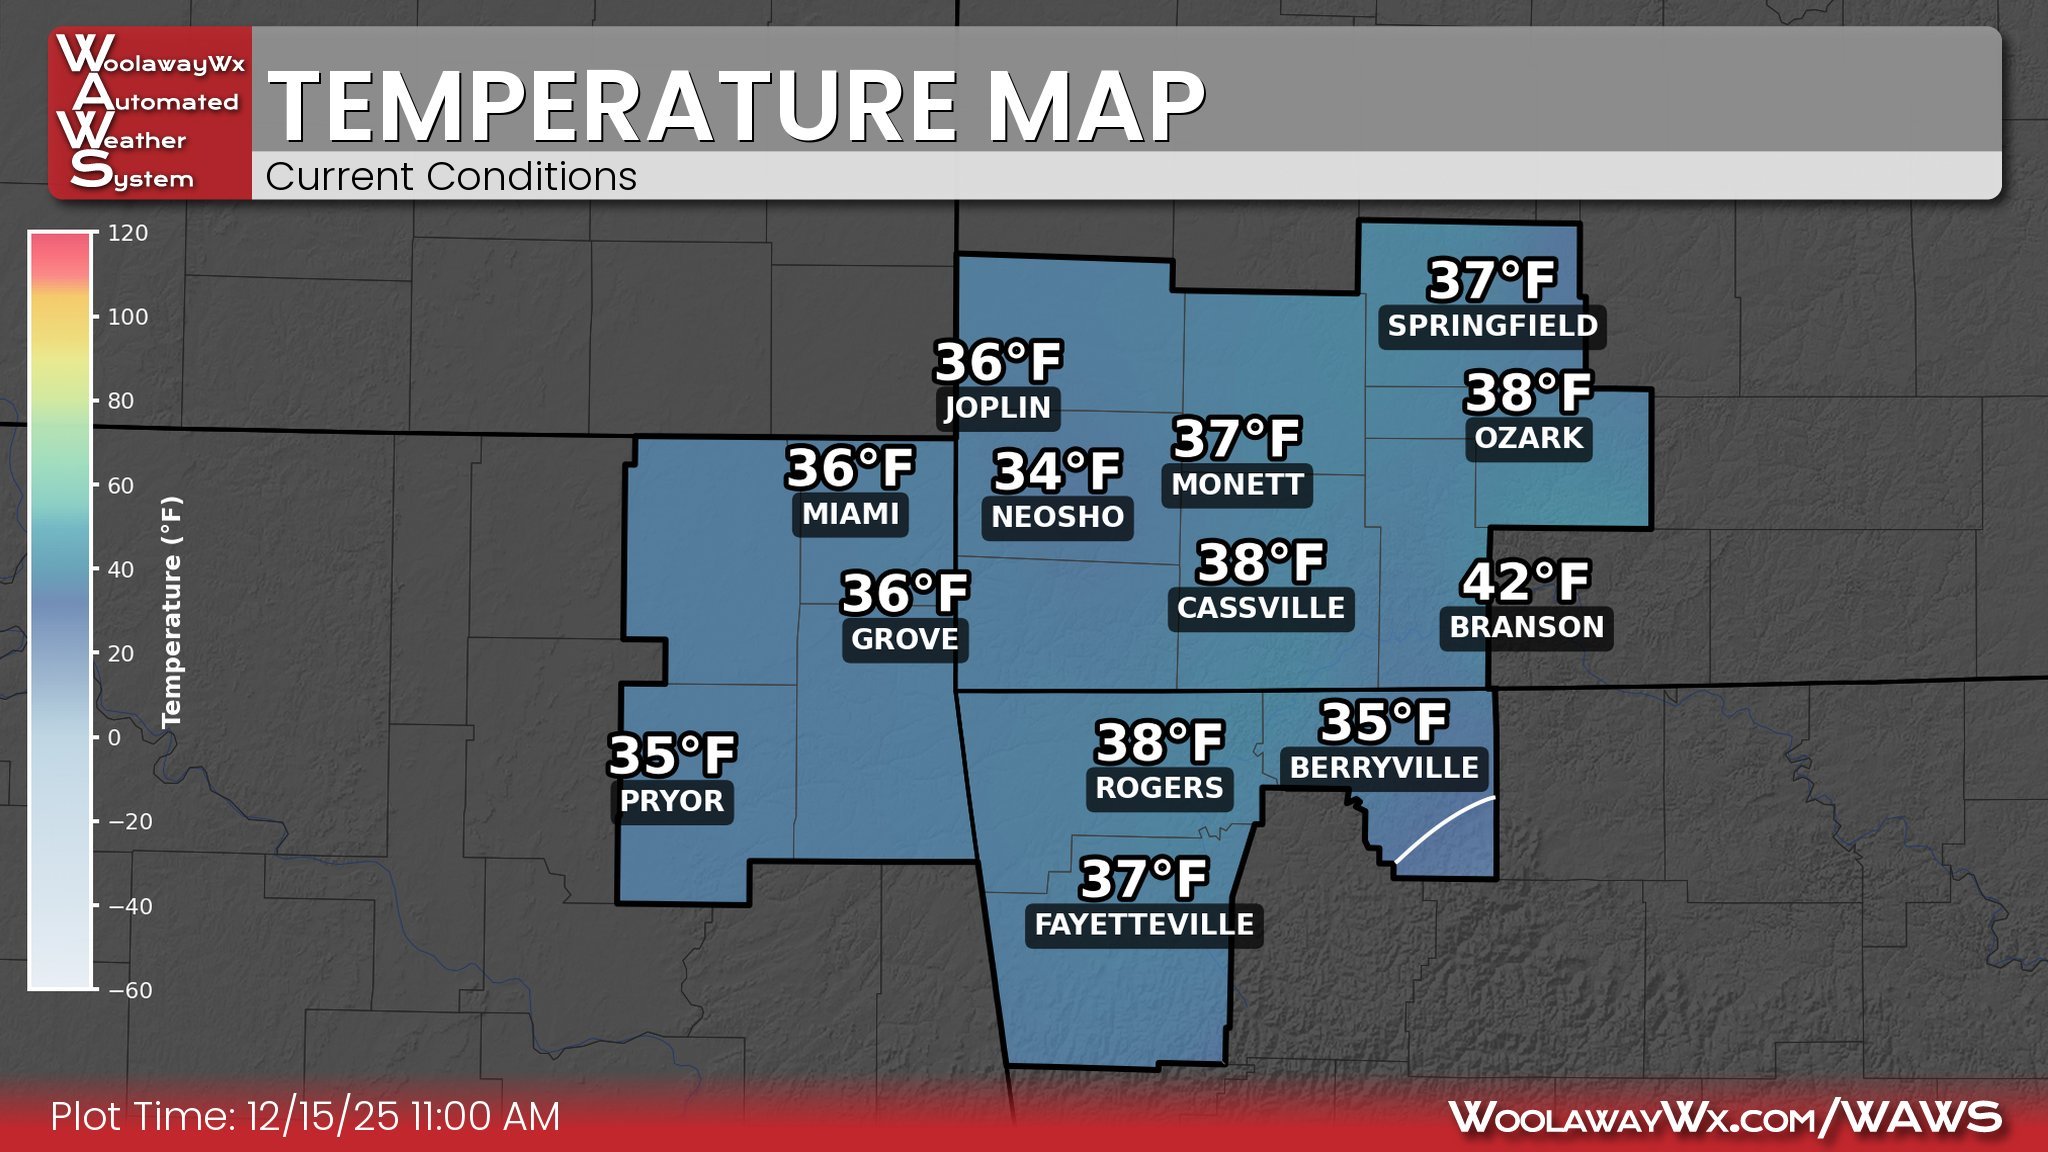
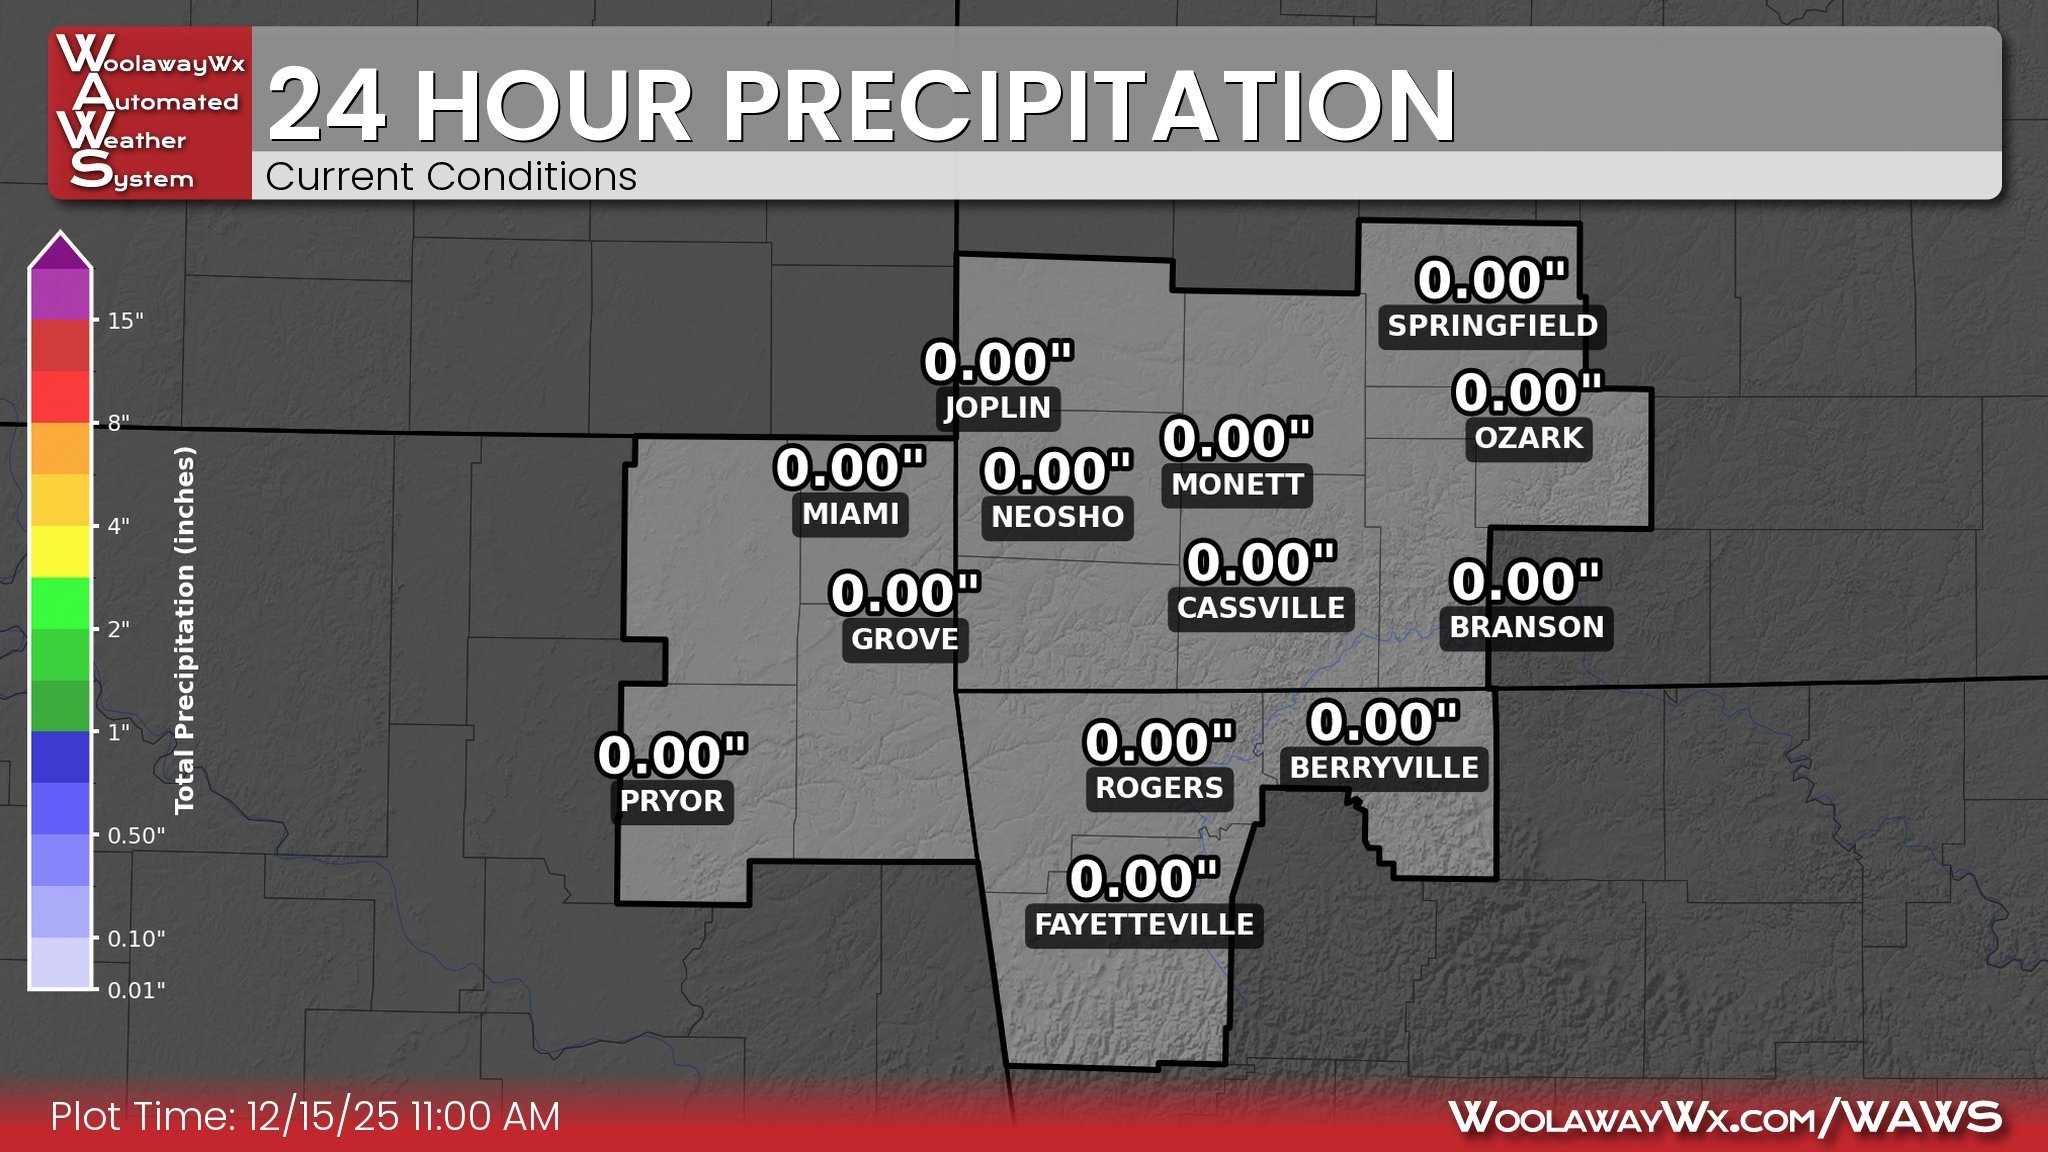
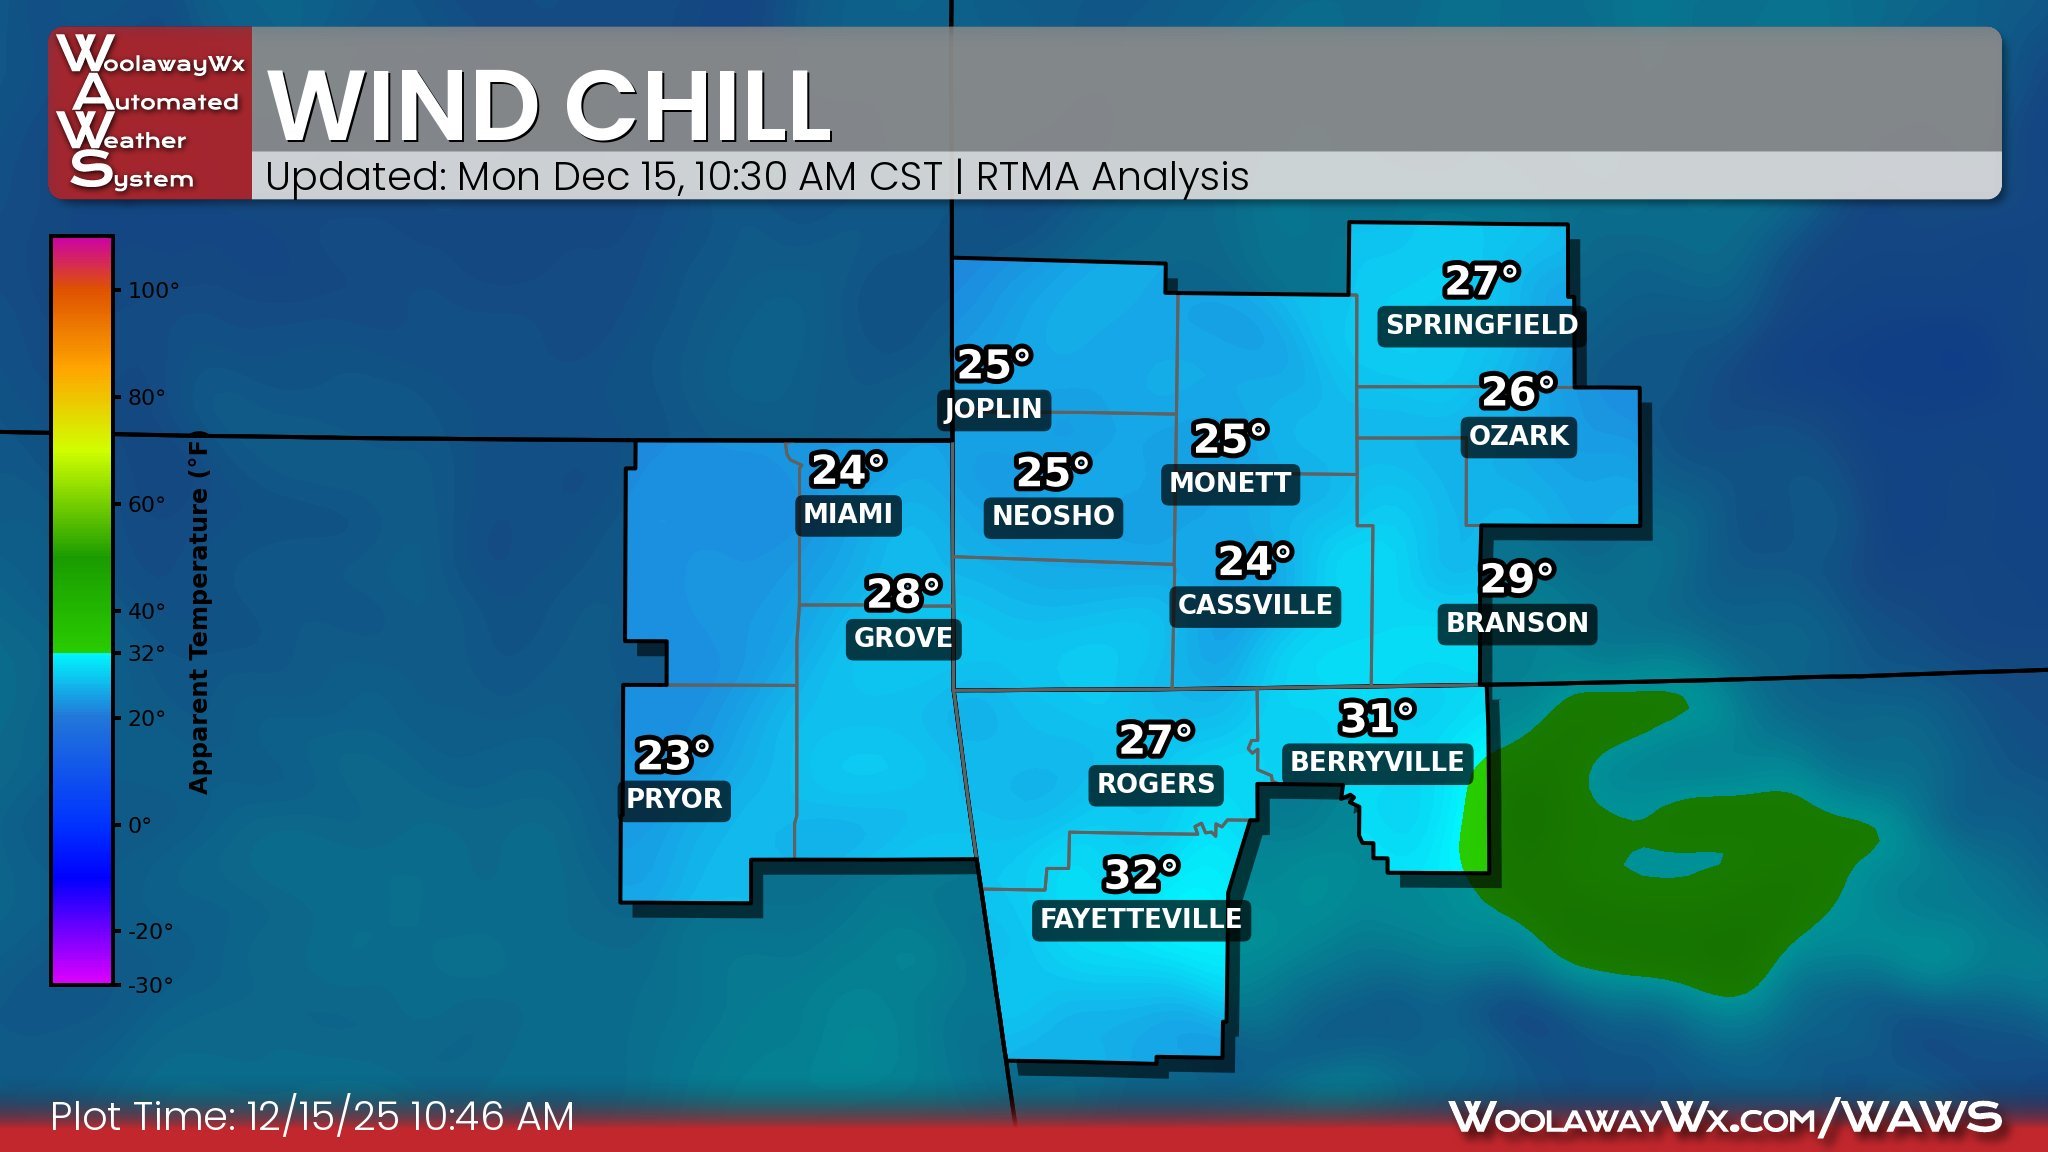
Current Conditions
Current Temperatures
Weather Station Based
24 Hour Rainfall
Weather Station Based
Apparent Temperature
RTMA Based
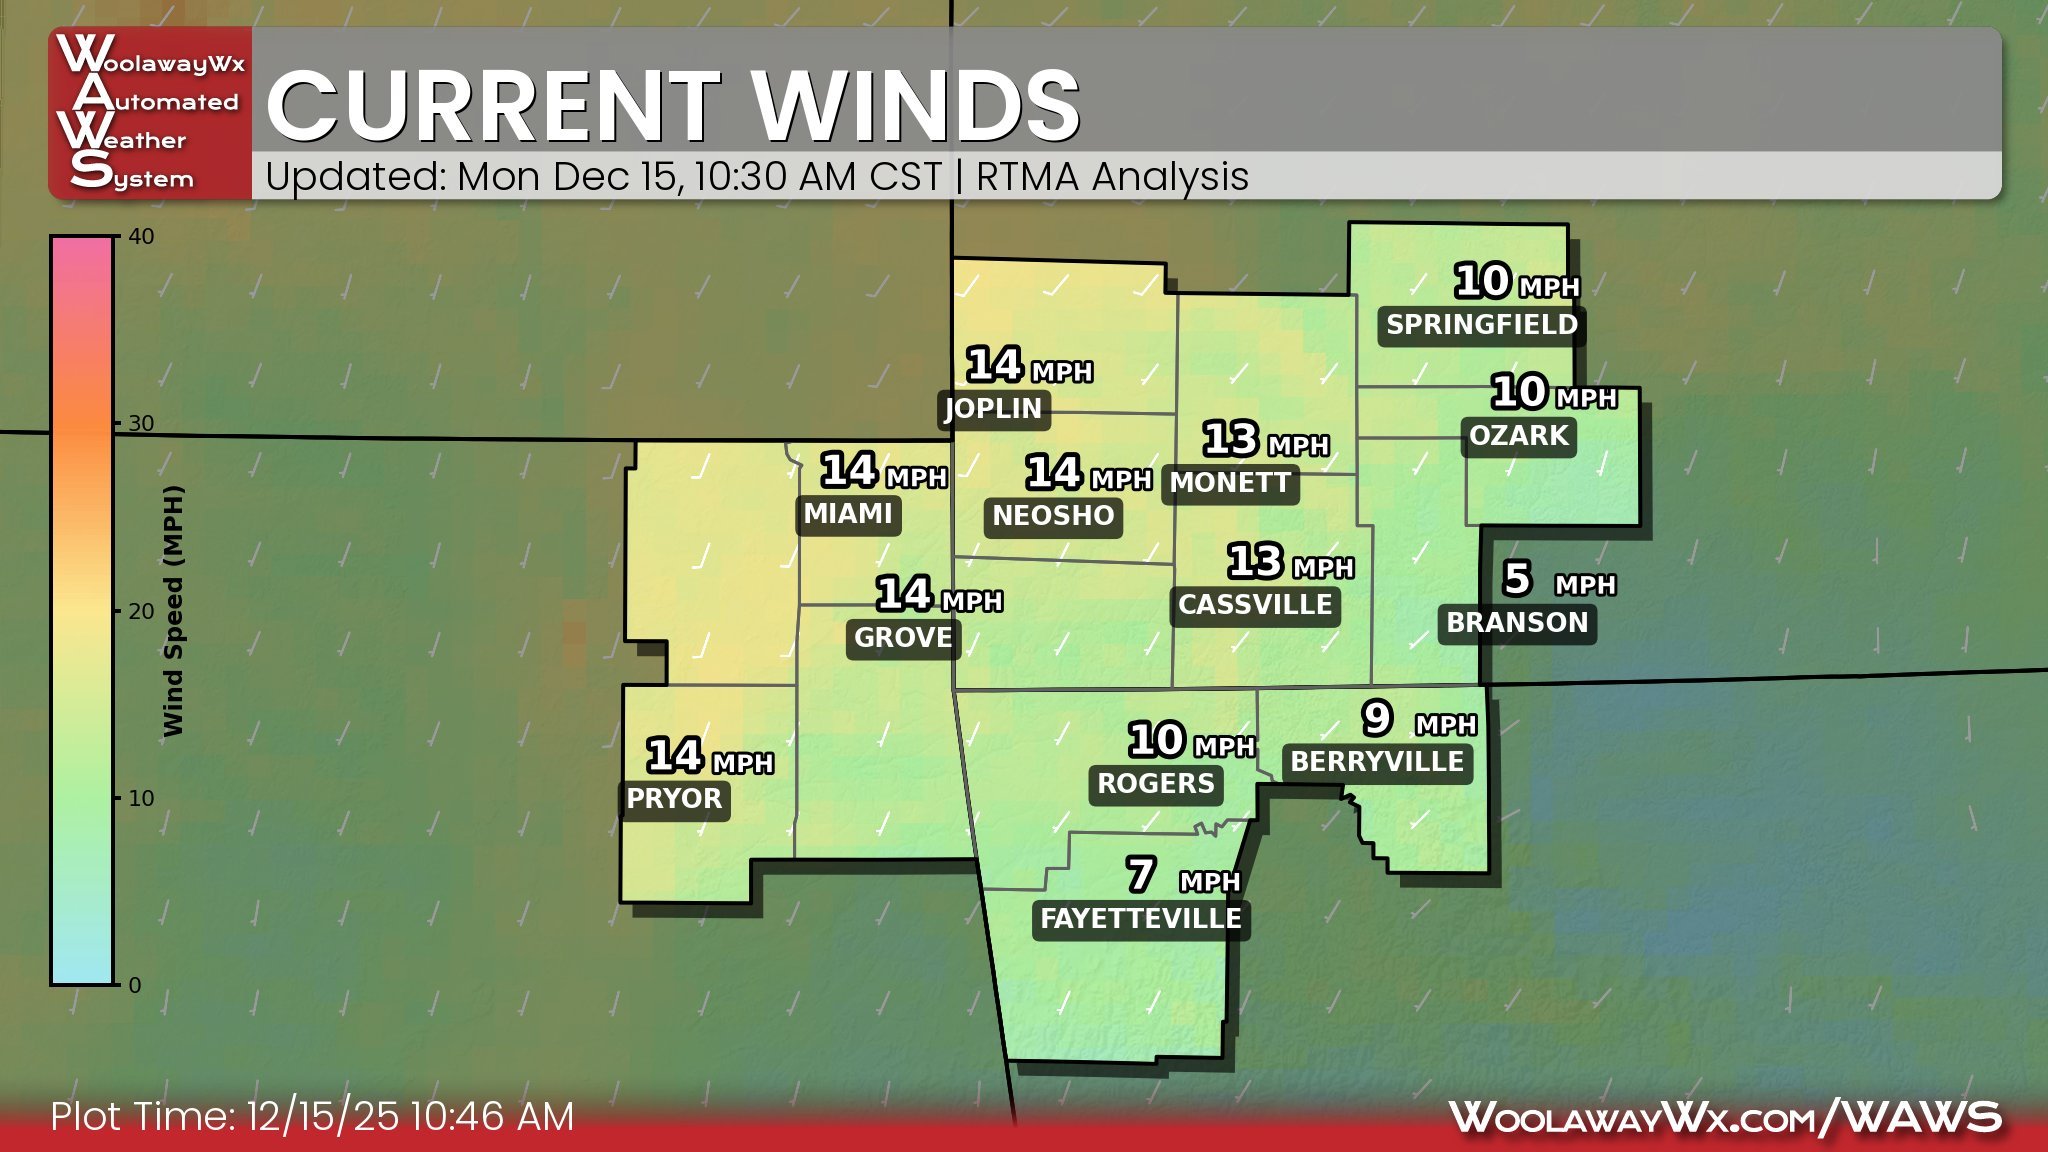
Wind Speed & Direction
RTMA Based
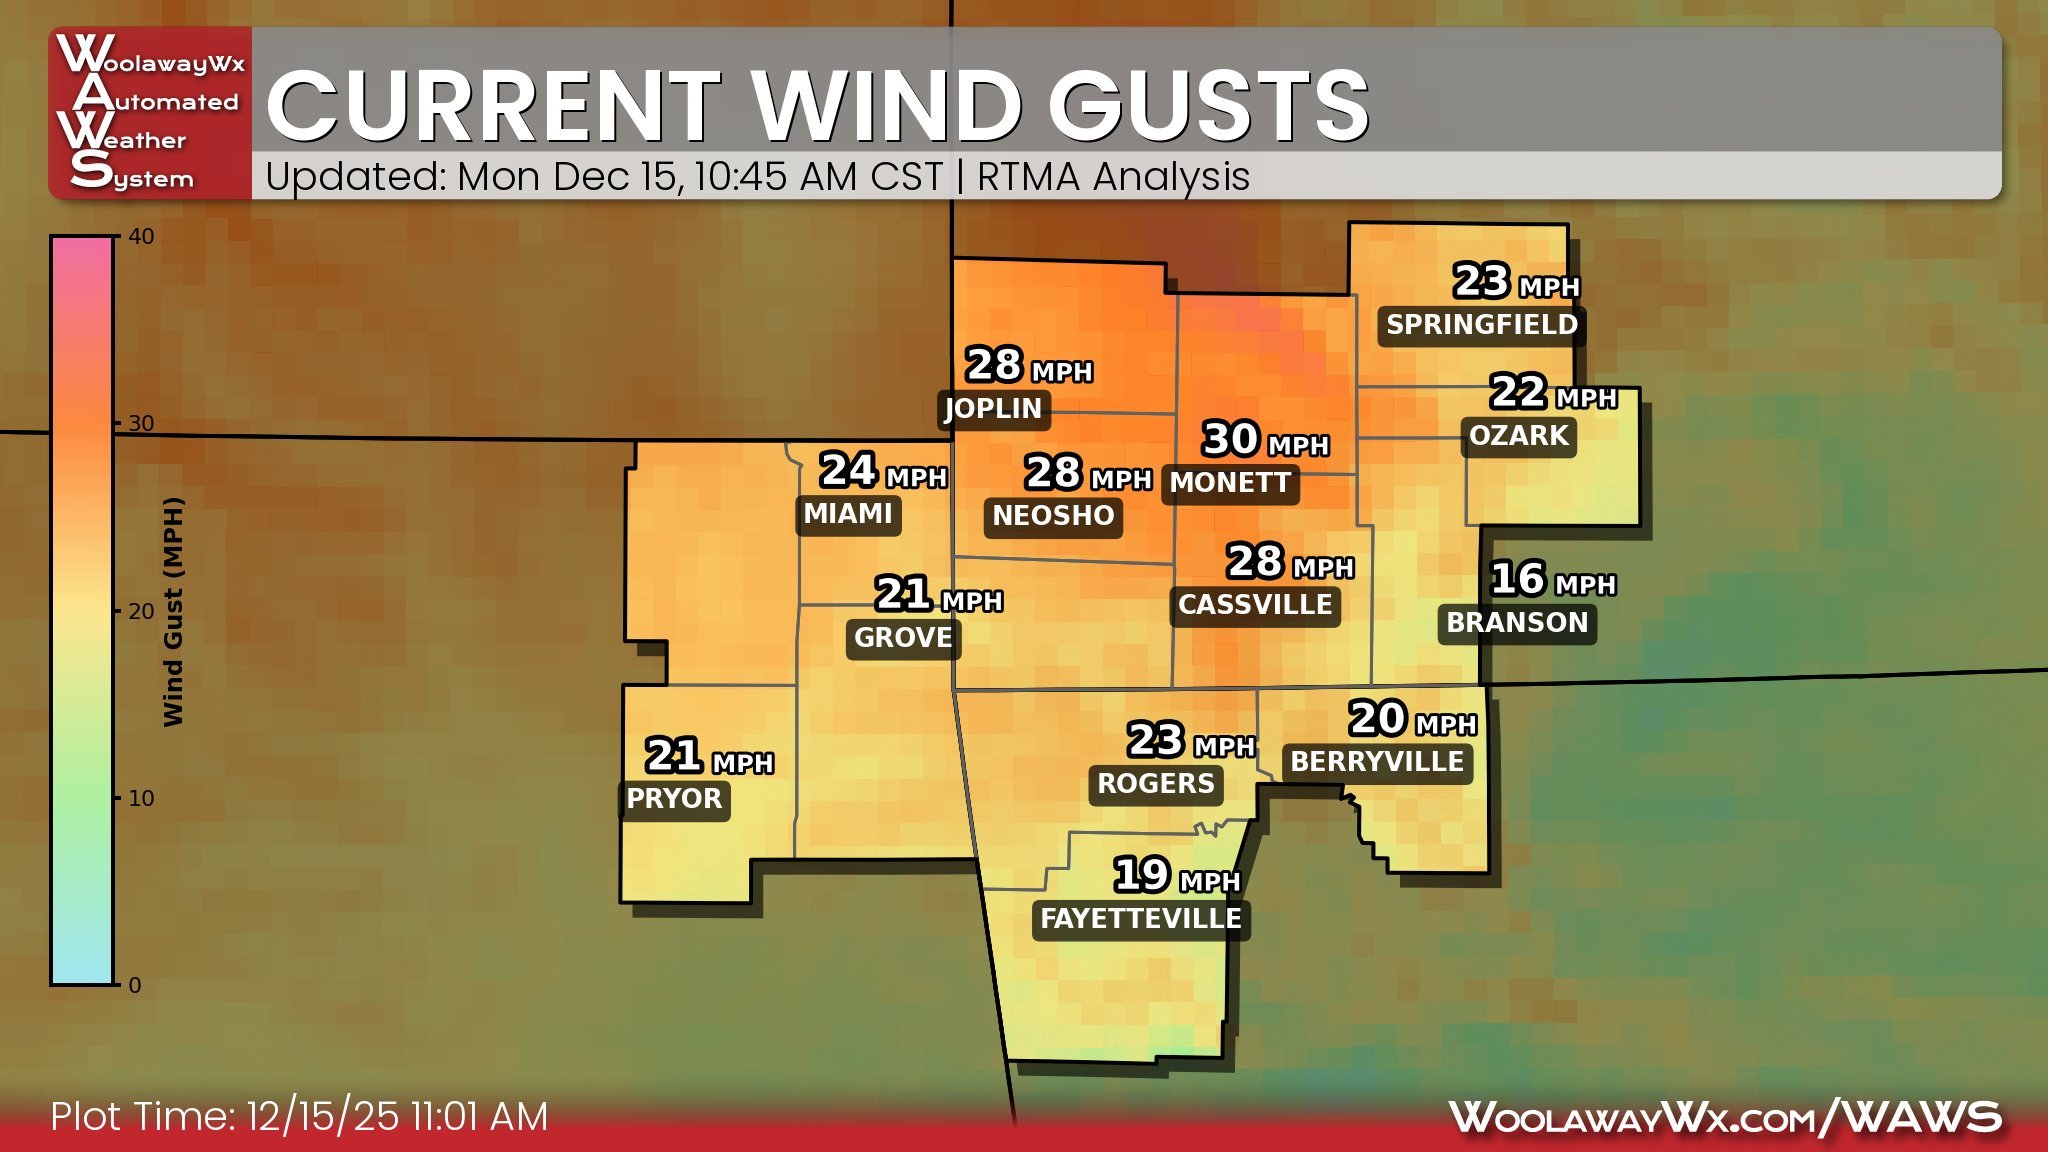
Wind Gusts
RTMA Based
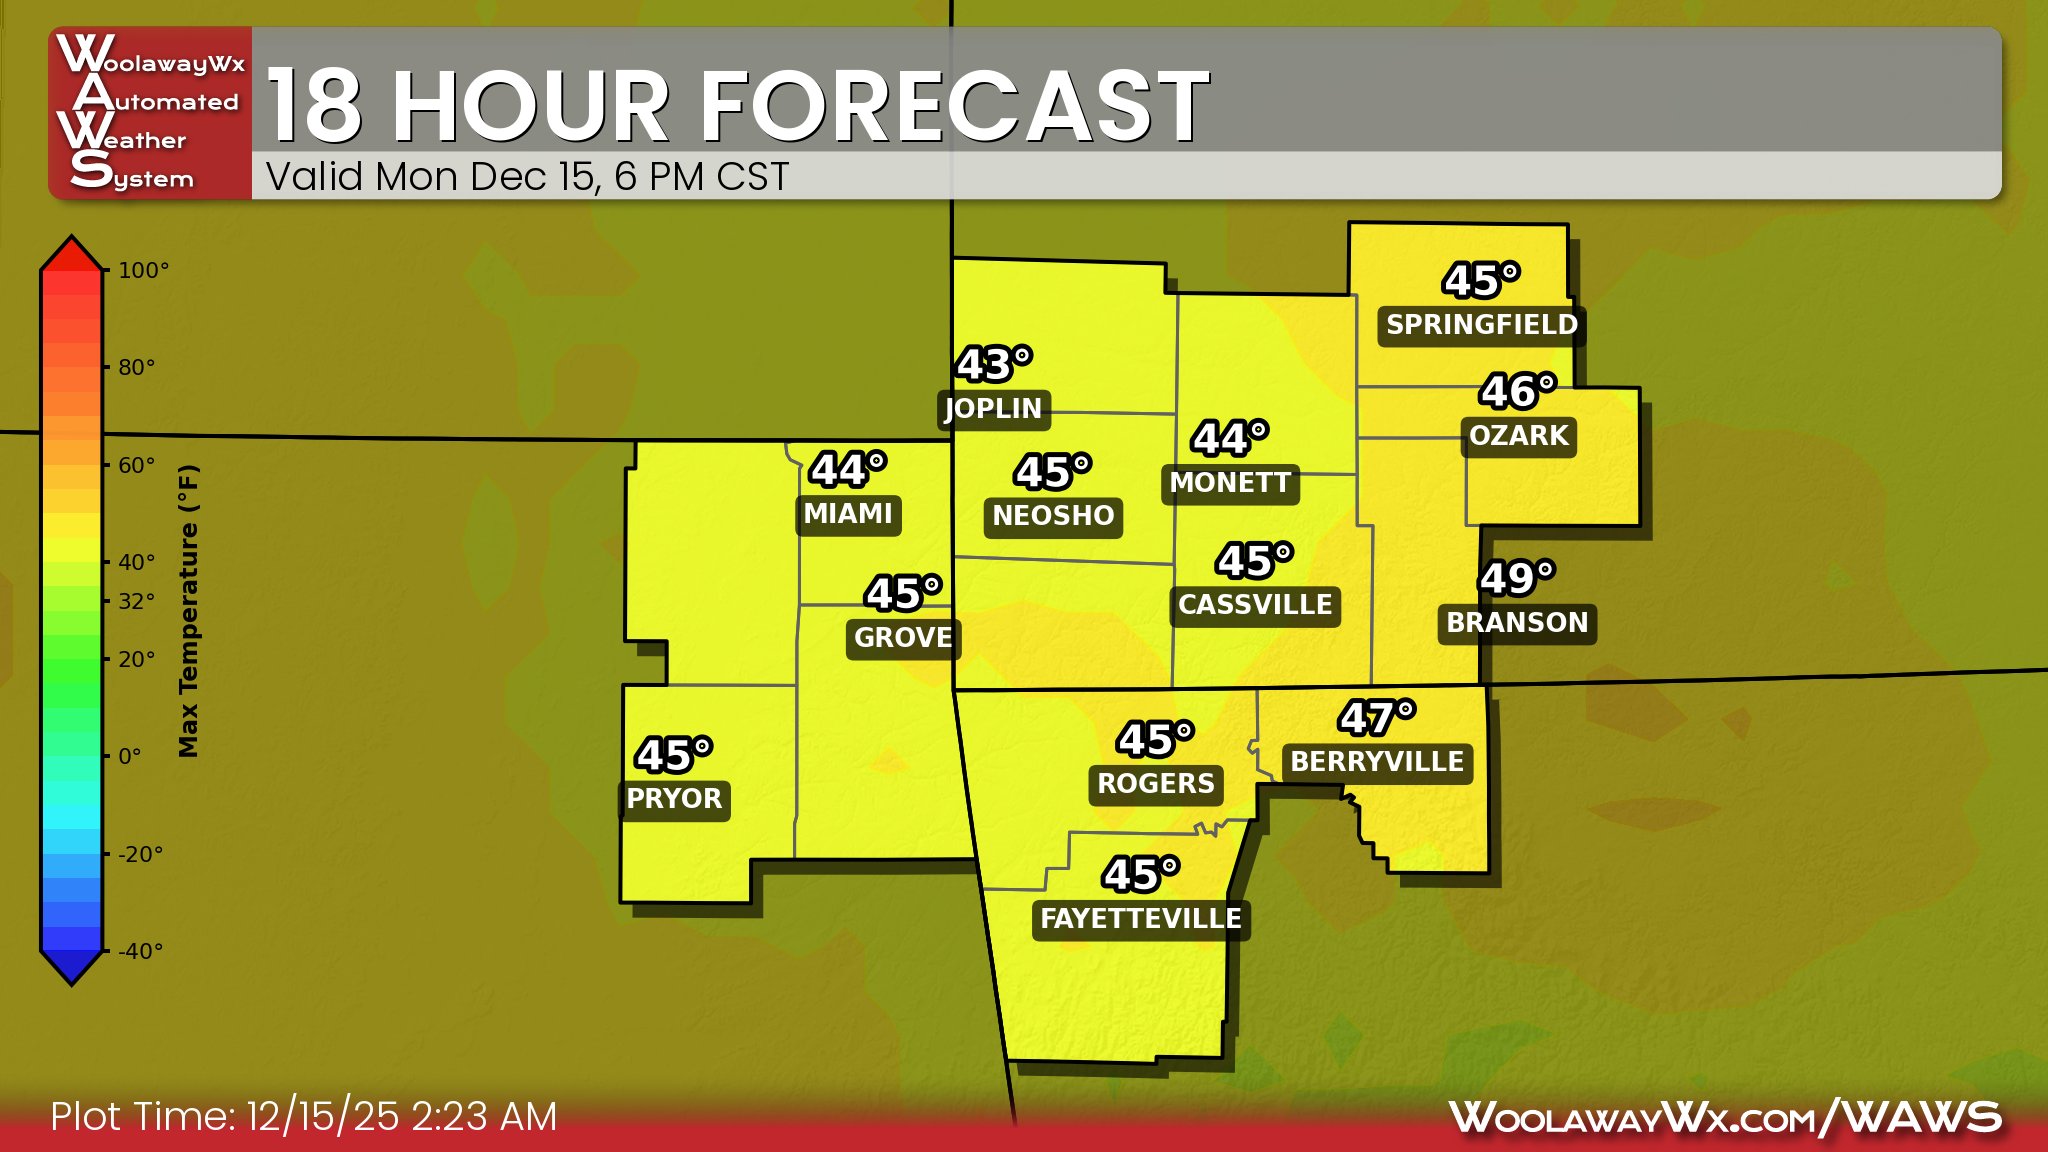
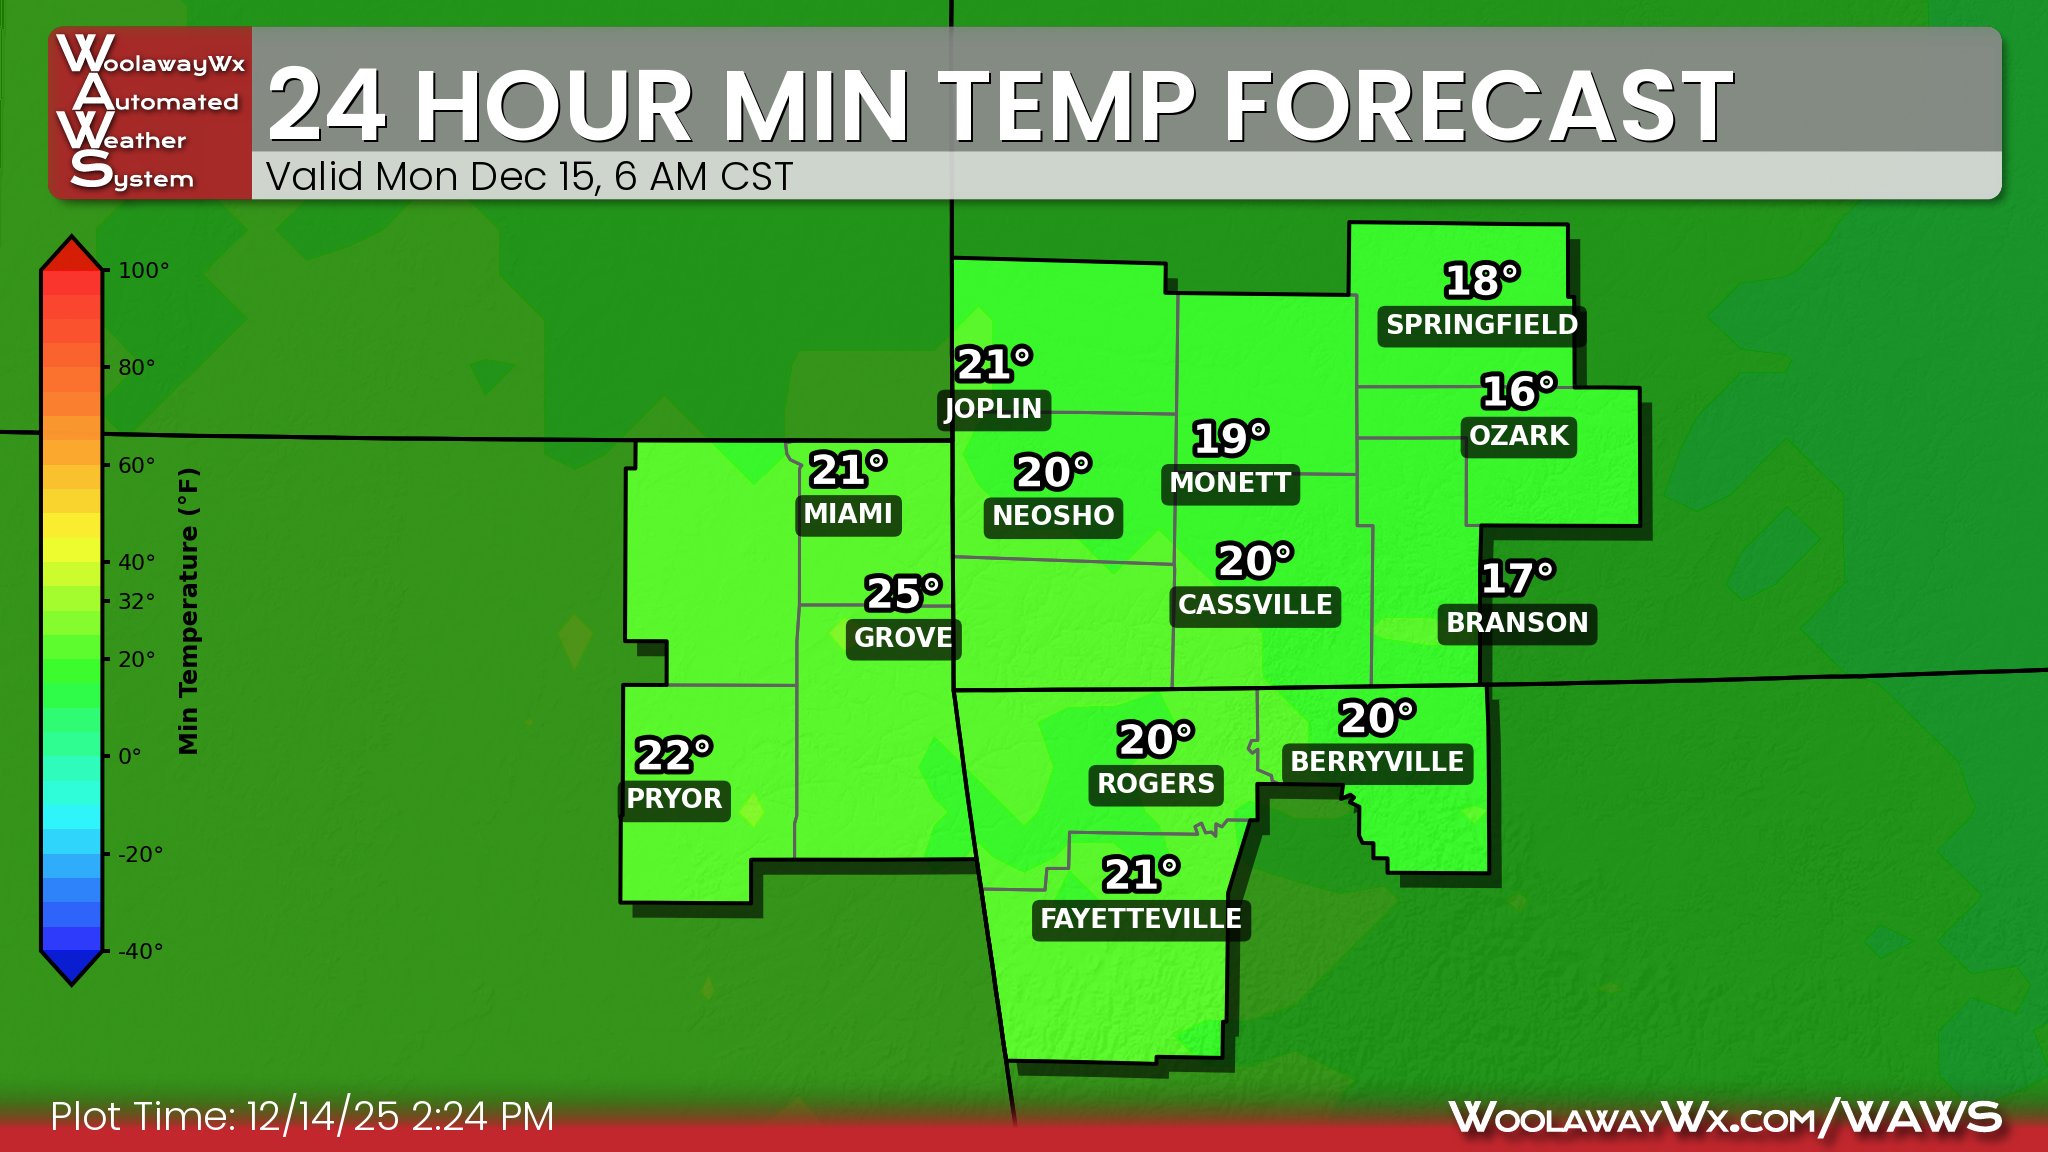
24 Hour Temperatures
24 Hour Maximum Temperature | NBM Based
24 Hour Minimum Temperature | NBM Based
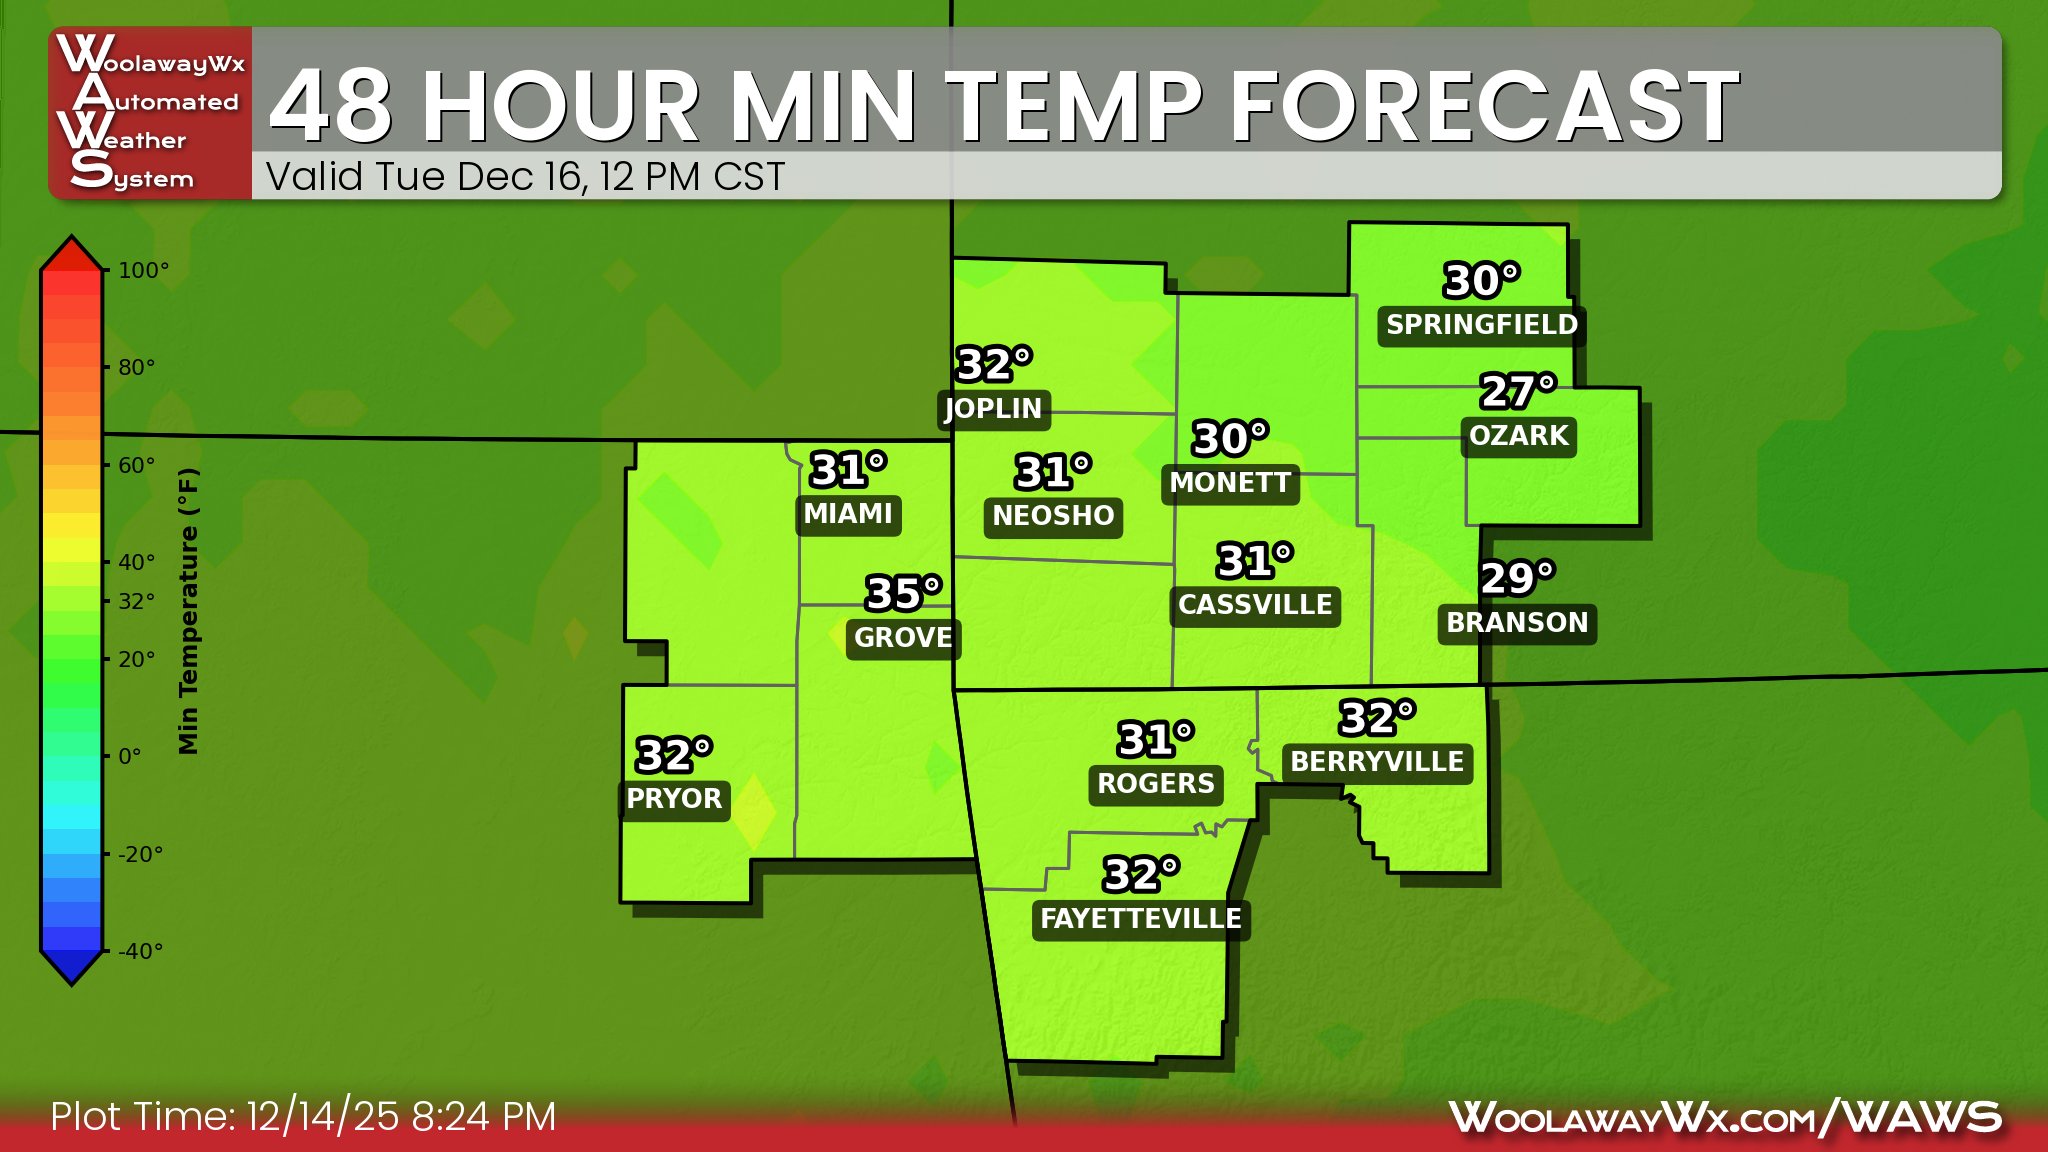
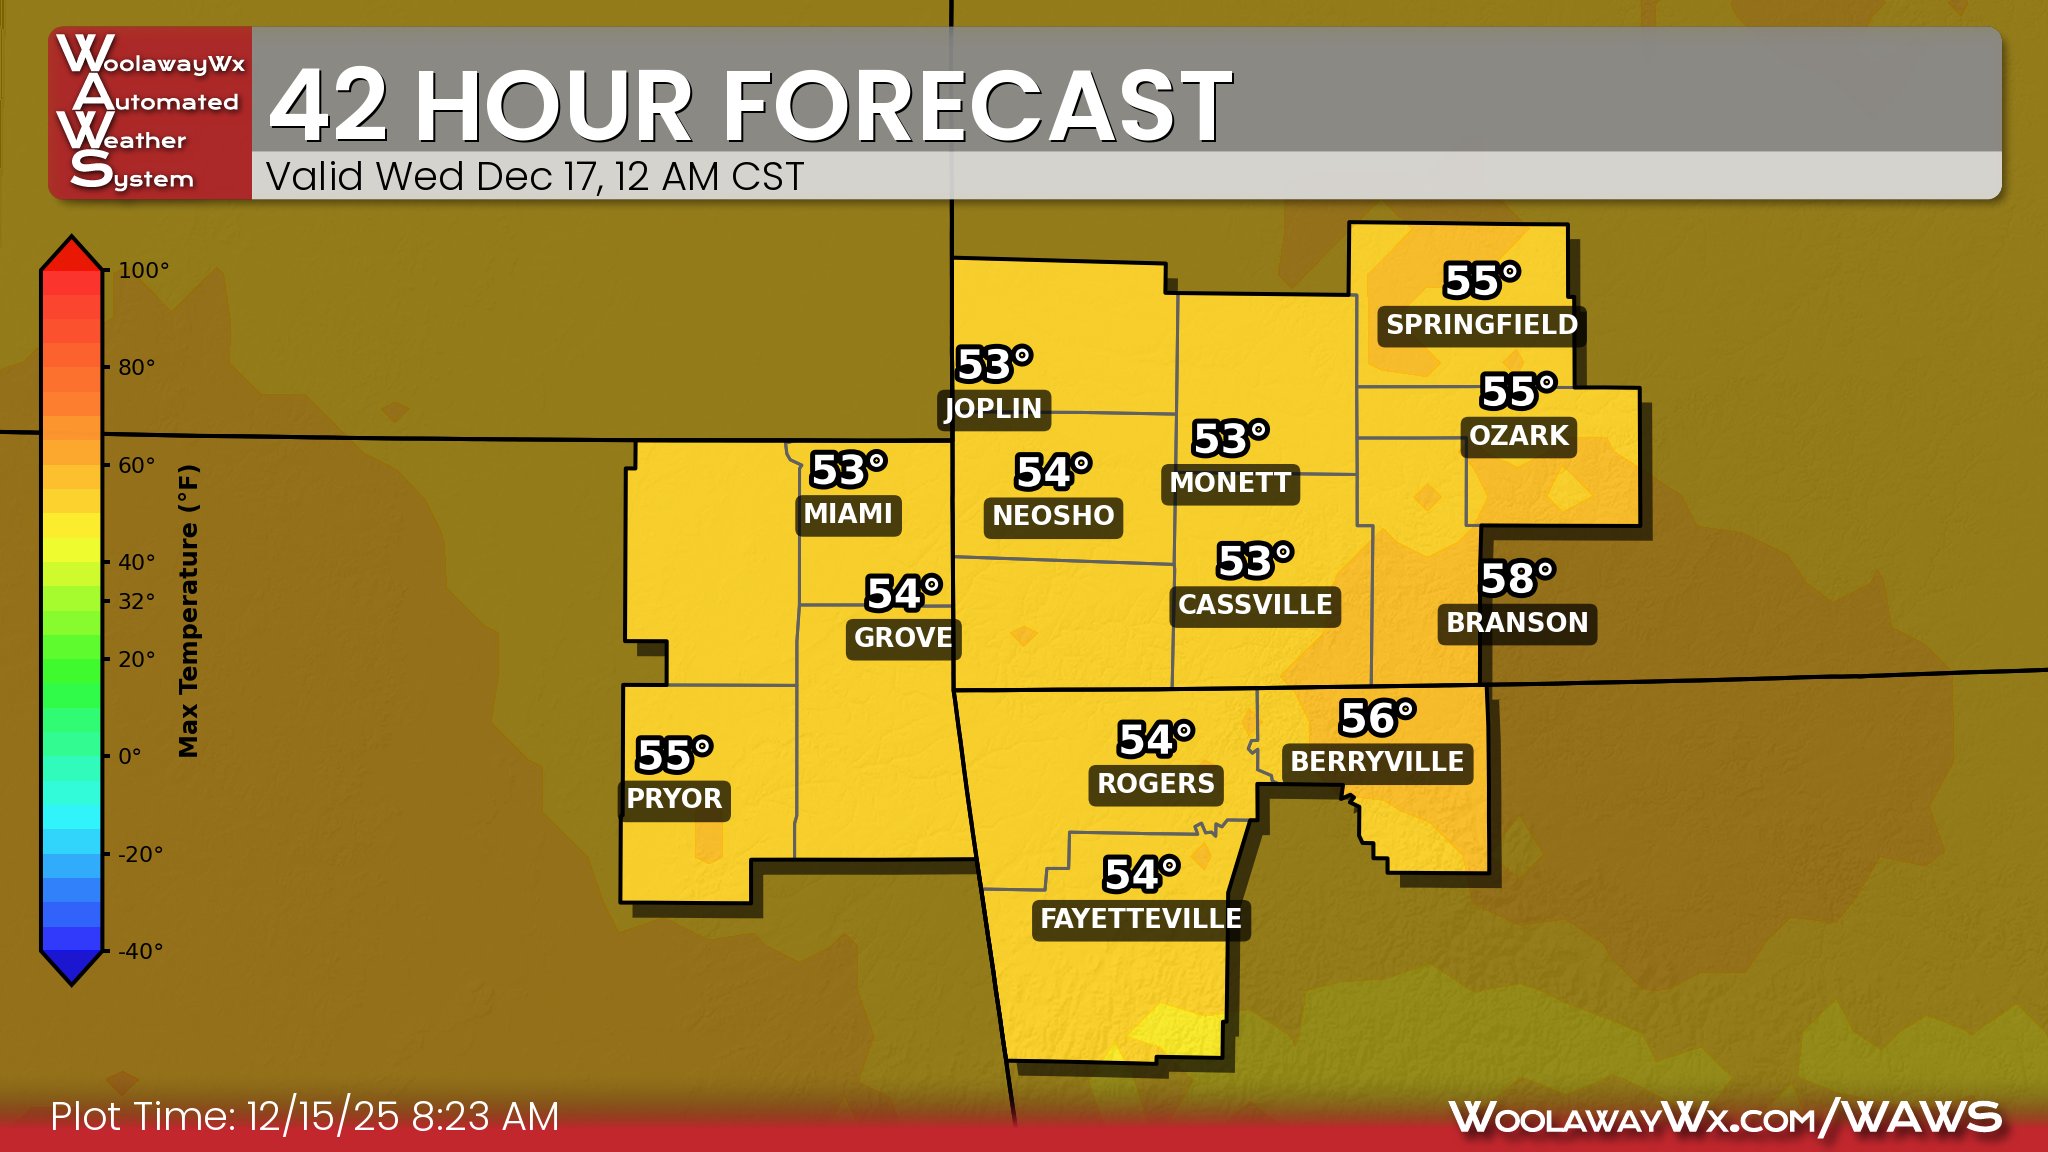
48 Hour Temperatures
Day 2 Maximum Temperature | NBM Based
Day 2 Minimum Temperature | NBM Based